WHEN INVESTING IN GOOD QUALITY, THE COSTS OF POOR QUALITY CAN SIGNIFICANTLY BE REDUCED
“ It should be no brainer for companies to determine competitive, profit inducing prices for their devices and services. In fact, the well-known equation is: manufacturing costs + profit margin = price. However, this seemingly simple and straight forward equation quickly sells itself a bit short, once diving deeper into the question of how many companies are actually fully aware of the quality-related costs that keep piling up when moving along the production chain? ”, asks Sparklike’s Development & Quality Manager, Mr. Jarno Hartikainen. He has – due to his significant career inprocess development within the biorefining industry – a broad expertise in business and analysis development with special emphasis on product quality improvement and is therefore the right person to tell how to reduce manufacturing related quality costs.

It is particularly challenging trying to manage the quality-related manufacturing costs if the actual cost factors are not rigorously determined. To that end, this article, centers around the quality costs and the cost management measures. When accurately managed, companies can expect an important reduction in costs as well as a significant increase in their gross profit. Each company should have a clear aim of considerably reducing their quality-related costs. However, too many companies focus more on reducing costs, in general. At the same time, they might overlook the many benefits of truly recognizing the causes of their quality costs. Finally, more companies should be more eager to turn the situation to their advantage by investing in proper quality control equipment.
It has been estimated that quality costs account for approximately 20% of company’s annual turnover. Therefore, when imagining an annual turnover of 100 and overall costs 90, the gross profit will be 10. However, it is normal for companies to aim to double their annual turnover. There are two clear options that come in mind when considering how this goal could be achieved: either by growing annual turnover or by reducing costs. Nonetheless, meeting this goal by doubling the turnover, can be a bit too much for some companies to face head on. The second – and to some companies, the only viable option – would then be to reduce their overall costs. In this regard, quality-related costs are a great place to start.
Often the easiest and quickest way to cut down costs, is either by letting employees go, tightening processes or by aiming for the minimum level of acquired quality. However, how many successful companies can actually afford to put in only the minimum acquired effort in order to maintain the integrity of their production quality? “ This could be something that might work occasionally, but quickly the amount of reclamations, additional warranty works, compensations, product returns and eventually, the loss of loyal client base will inevitably turn into extra costs ultimately exhausting company’s initial savings gained through lowering their production quality, “ Mr. Hartikainen says.
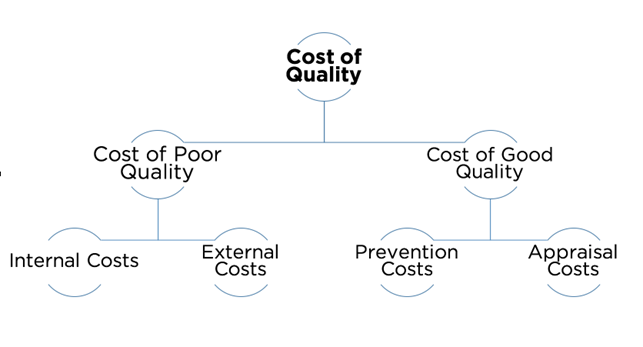
To get a closer look at the different components of quality-related costs, it’s useful to consider the two different categories originally presented by Jack Campanella in 1999 in his article titled: Principles of Quality Costs – Principles, Implementation and Use: the cost of poor quality and the cost of good quality. The figure number 1 below represents costs of quality, dividing costs of poor quality further into internal and external costs and the costs of good quality into prevention and appraisal costs.

Campanella (1999) emphasizes how determining the causes for the cost of poor quality can render them more manageable when the prevention costs are significantly intensified. Furthermore, Campanella explains how one unit of currency invested to the appraisal costs and the prevention costs – in other words toward the costs of good quality – reduces the cost of poor quality, many times over.
How you minimize manufacturing related quality costs
The following chapter lists in more detail what are the seven different ways to reduce quality-related costs. This further categorization and point-by-point presentation makes it a lot easier for companies to identify and successfully manage their quality-related costs in a revenue enhancing way, while keeping their production quality in line with customer expectations.
PREVENTION COSTS
- Product or service requirements — establishment of specifications for incoming materials, processes, finished products, and services
- Quality planning — creation of plans for quality, reliability, operations, production, and inspection
- Quality assurance — creation and maintenance of the quality system
- Training — development, preparation, and maintenance of programs
APPRAISAL COSTS
- Verification — checking of incoming material, process setup, and products against agreed specifications
- Quality audits — confirmation that the quality system is functioning correctly
- Supplier rating — assessment and approval of suppliers of products and services
- Supplier rating — assessment and approval of suppliers of products and services
A great example of controlling the costs of poor quality by investing in good quality is, investing in proper quality control equipment that helps to improve as well as to enhance quality control. However, these types of devices are often considered as significant investments. In reality, the payback period for the investment is extremely short. The popular saying:” Quality is free, but low quality always comes with a price”, can act as a viable guideline that everyone responsible for quality would do well to remember and to live by.

The awareness on how comprehensively the quality-related costs are actually under control, can only increase when investigating the various causes for quality-related costs. An example could be a company that manufactures insulating glass units (IGU’s) systematically controlling the quality of every hundredth unit manufactured. At the same time, the production line has known to struggle with quality challenges related to sealing the unit and therefore, every 10th unit has this particular defect. This, in return, leads to 50% of the insulating gas to escape by the time the IGU is ready to be shipped to the end-consumer. The probability of appropriately identifying this defect with the current level of quality control is, merely 10%. It could even be that the general standards don’t require more, but can the company in good conscience let the units leave the factory and still be confident that their production quality meets, let alone exceeds, customer expectations?
The bottom line is that every customer expects notable quality. In the end of the day, each company is as good as the quality of their devices and services. Therefore, it is hard to believe that any company would voluntarily give competitive advantage to their competitors due to improper quality management. In reality, no manufacturer can afford to ignore their manufacturing quality, just because in short term they might save some money by not investing in proper quality control equipment. However, their company’s reputation should be worth much more than that.

“ To sum up, the truth is that in today’s competitive world, accuracy, reproducibility, traceability and trustworthiness are of outmost importance. In addition, customers want to be able to trust in the integrity and the ability of the manufacturer to meet the prevailing norms, regulations – and most importantly, customer expectation. Time is money, and customers seldom, if ever, can afford to forgive errors, ” concludes Sparklike’s Development & Quality Manager, Mr. Jarno Hartikainen.
Finally, to keep reading why there’s no need to break the insulating glass unit – by using Sparklike non-destructive gas fill analyzers – in order to conduct insulating glass unit’s argon fill analysis, click this link.


